


Lately, it seems that you can’t read an online article or browse social media without coming across an infographic. Considered one of the most powerful marketing tools in use today, is it just a trend that will soon be on the way out or is there more than meets the eye to this form of visual media?
As a whole, society suffers from “information overload.” According to research, we receive five times as much information today as we did in 1986, and because our brains can only handle so much, we simply can’t keep up with all the facts, figures and data thrown our way daily. In fact, a study found that users typically read 28 percent of the words on a webpage during an average visit and are more likely to read less. That doesn’t bode well if you rely solely on blogs, press releases or articles to convey important information to your audience.
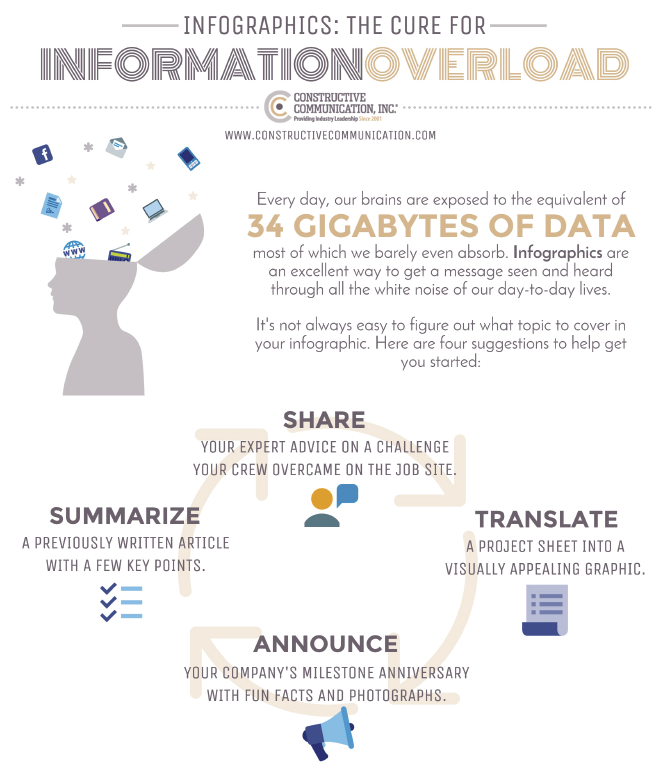
This is where infographics step in and show their value as the perfect counter to information overload. A combination of the words “information” and “graphics,” they convey data through images, charts or other visual means designed to make the information easily understandable at a glance.
Harvard Business Review calls infographics “an instant revelation.” The brain processes text sequentially but images simultaneously, so information in a visual format is immediately conveyed. Think of it this way: it’s much easier to draw a circle than to describe it! Our often-overloaded brains love when most of the work is done for them, which may be why infographics are 30 times more likely to be read than an all-text article.
Facts speak for themselves
If that isn’t enough to convince you why you should integrate infographics into your marketing, here are a few more convincing facts:
People more readily share infographics. On Twitter, for example, tweets containing infographics are retweeted 832 percent more than their text-only counterparts.
Infographics increase brand awareness. Subtle placement of a logo or brand colors on an infographic can serve as an advertisement for your business or organization. People are much more eager to share a branded infographic than they are an ad, and it gets your name out there just as well as an ad, if not better.
Infographics drive website traffic. Including your website or contact information on an infographic will lead readers back to your site. This can increase exponentially if your infographic is shared on blogs (make sure you’re credited!), Facebook, Twitter, Pinterest or other social media, as it will link directly to your website or social media account.
Infographics position you as a thought leader. Putting an abundance of research into an easy-to-digest graphic shows expertise and knowledge on the subject. Your reputation and credibility as a leader in the industry will be solidified.
Choose the right words
Now you know why you should use infographics in your marketing efforts, but you also need to know what to say and how to say it:
Tell a story. What is the main message you want people to take away from your infographic? Start there, using a relatable hook or question to draw them in. Then, break it down into smaller, easily digestible pieces. People enjoy narratives, not info-dumps.
Know the facts. When compiling data for your infographic, be thorough in your fact-checking. You don’t want incorrect information on a graphic that bears your company’s name. Come up with the facts first and let them guide your message. It’s much easier for the data to drive the topic, rather than picking a message first and trying to find stats to support it.
Obey the laws (of design). While you may want to cram every little fact into your infographic, people are more drawn to simple design with white space around it. It’s easier to read and avoids that dreaded information overload. Instead of spelling things out, use charts or graphics to help tell your story. Keep your color scheme and font usage simple as well.
Make it yours. Be proud of all the hard work you’ve put into your infographic. Let the world know that it’s yours by using your brand colors or including your logo. This helps solidify brand recognition and informs people that you’re a thought leader. Remember to tout these graphics on your website and social media accounts.
If your marketing experience is limited to press releases, ads and articles, don’t be afraid to add infographics to that mix. Armed with the above knowledge, you can create informative and eye-catching graphics to share with clients, colleagues and editors alike!